Grow
Analytics
What shoppers save, what they buy from their wishlist, and how much revenue is still waiting in wishlists.
XB Wishlist counts what happens around the wishlist: saves, removals, wishlist page views, add to cart from the wishlist and completed checkouts. The Analytics page turns that into charts.
On the Free plan the menu item is Analytics. On Basic and Pro it becomes Advanced analytics.
How it's tracked
- The Wishlist Analytics card in Features turns tracking on and off. It is on for new stores. When it is off, nothing new is recorded, and the charts stop at the day you turned it off.
- Purchases are tracked by a Shopify web pixel that XB Wishlist installs. It only counts products that were added to the cart from a wishlist. Shoppers' cookie consent choices are respected.
- Numbers are updated every hour, so the latest hour may not show yet.
Analytics (Free)
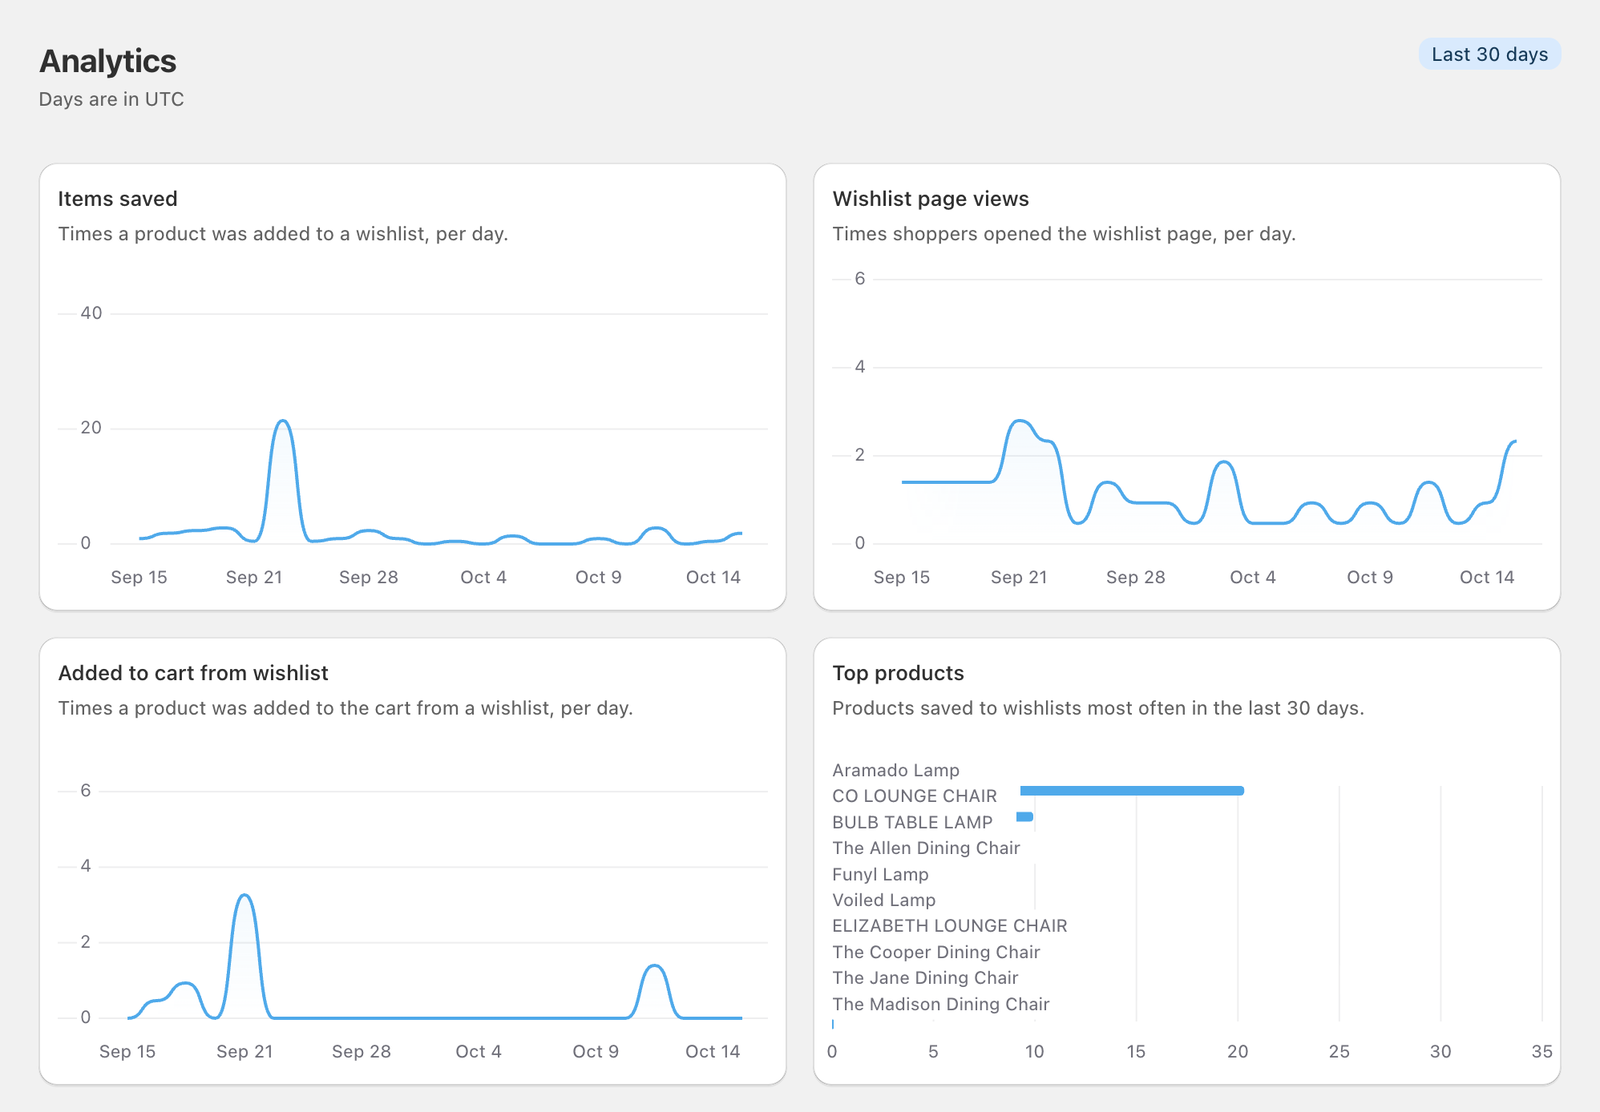
The last 30 days, in UTC:
- Wishlist page views: times shoppers opened the wishlist, per day.
- Items saved: times a product was added to a wishlist, per day.
- Added to cart from wishlist, per day.
- Top products: the 10 products saved most often.
Advanced analytics (Basic and Pro)
Pick any date range with the date picker: Today, Yesterday, Last 7 days, Last 30 days, Last 90 days, Last year or Custom. The page opens on the last 7 days.
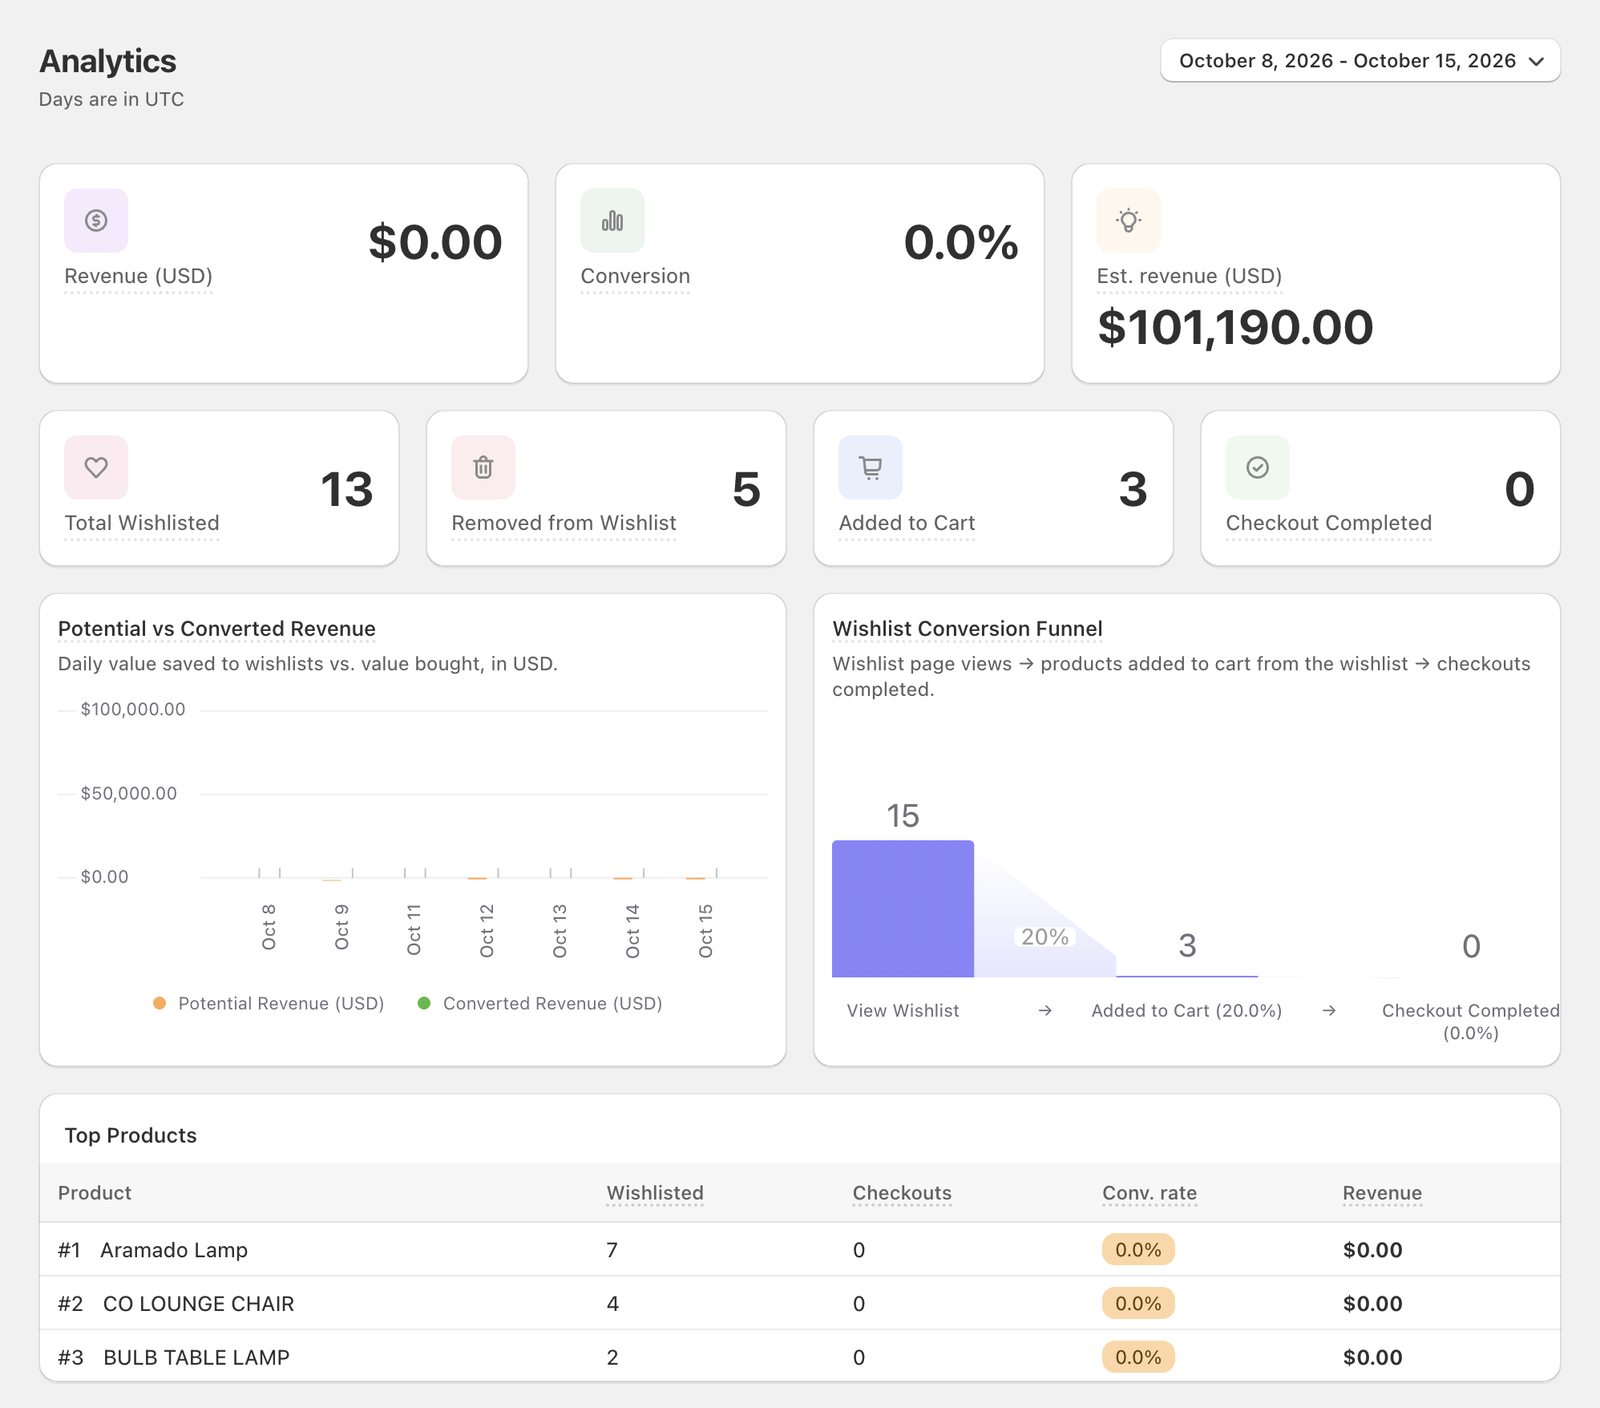
| Card | Meaning |
|---|---|
| Revenue | Value of wishlisted products that were bought in this period |
| Conversion | Checkouts completed from the wishlist ÷ products added to wishlists |
| Est. revenue | Value of what is saved in wishlists right now (added minus removed) in this period: what you could still earn |
| Total Wishlisted | Times a product was added to a wishlist |
| Removed from Wishlist | Times a product was removed |
| Added to Cart | Times a product went to the cart from a wishlist |
| Checkout Completed | Orders that included a product added to cart from a wishlist |
Below the cards:
- Potential vs Converted Revenue: estimated revenue next to actual revenue over time.
- Wishlist Conversion Funnel: View Wishlist → Added to Cart → Checkout Completed, with the share that makes it to each step.
- Top products: for each product, how often it was Wishlisted, its Checkouts, Conv. rate and Revenue.
Revenue is shown in your store currency. If some orders were in a currency that couldn't be converted, a banner says so, and those orders are left out of the totals.
Ideas for using it
- A product with many saves and few checkouts is wanted but not bought. Look at its price, its sizes and its stock. It is a good candidate for a price drop email.
- A high Est. revenue means a lot of demand is parked in wishlists. Turn on back-in-stock and price-drop emails to bring it back.
- Top products you're low on are worth restocking first.
Still stuck? Email [email protected] with your store’s .myshopify.com address and we’ll set it up with you.